Skip to content
Home Page
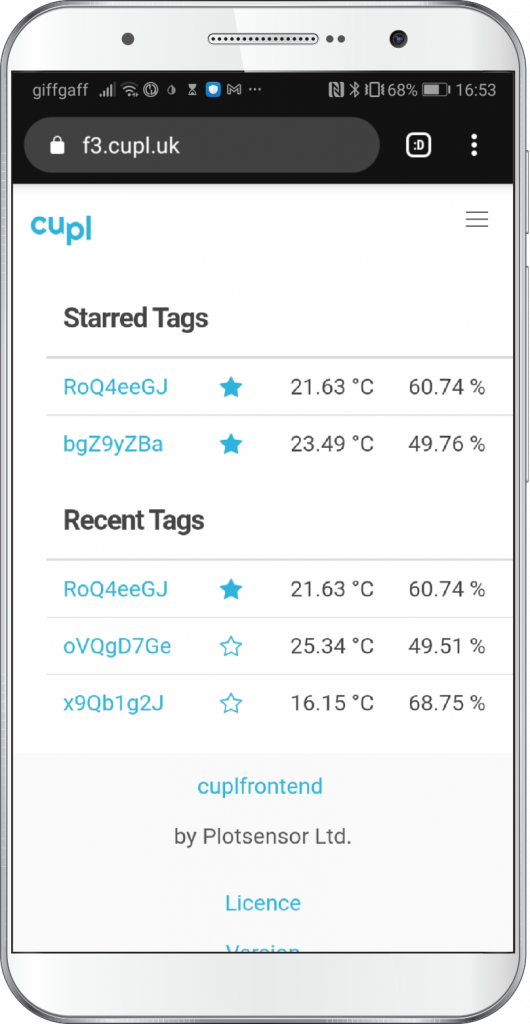 The home page shows a summary of starred and recently scanned tags
Tag Pages
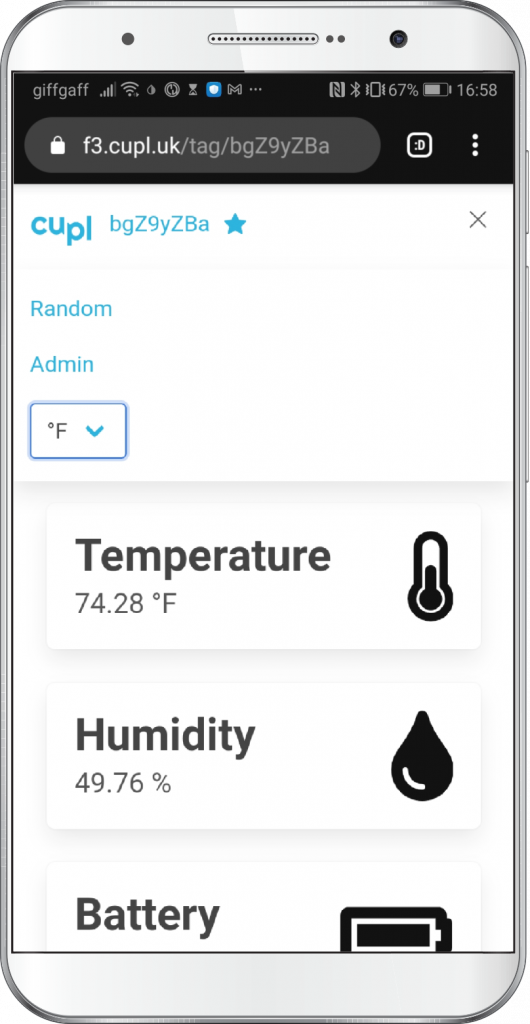
Latest Data
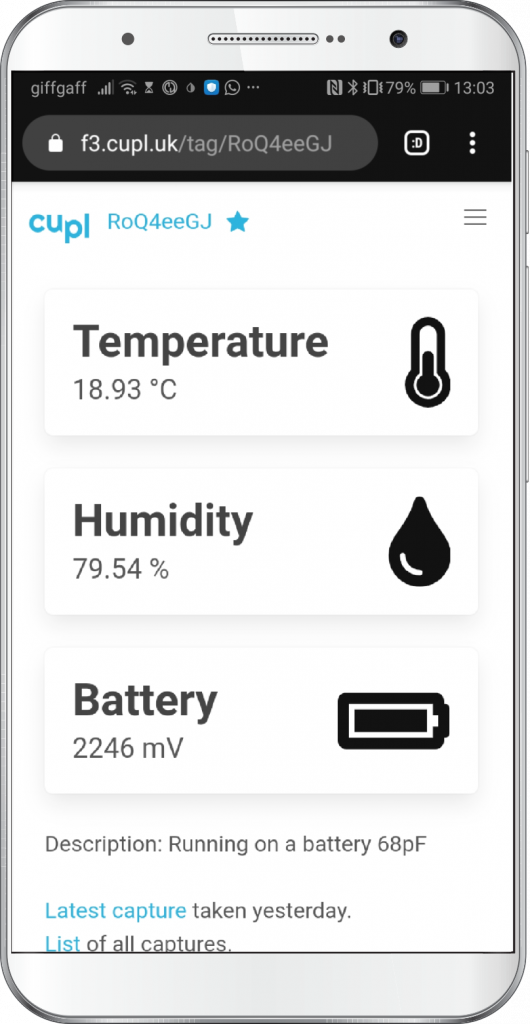 This page displays after a tag is scanned. It shows temperature, humidity and battery levels from the latest capture.
Calendar View
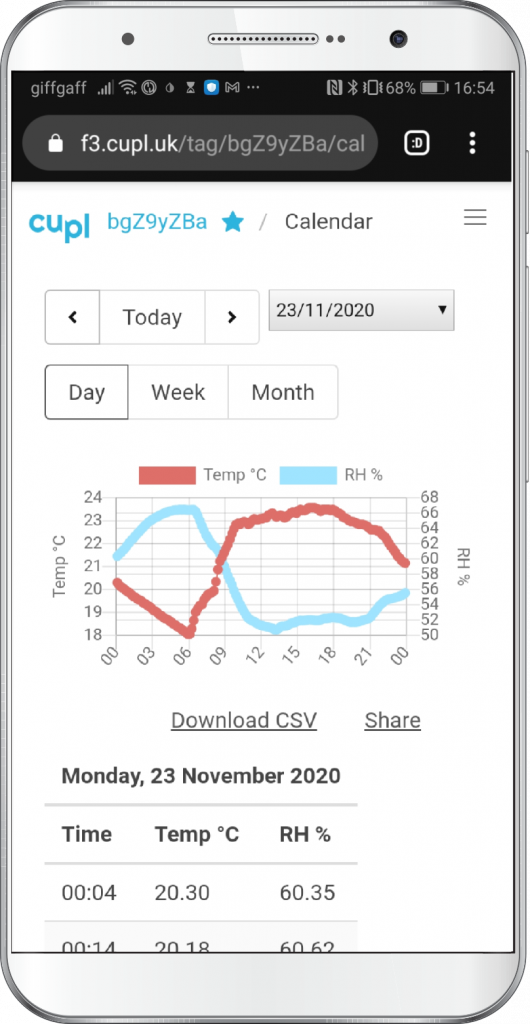 Plot of samples for one day.
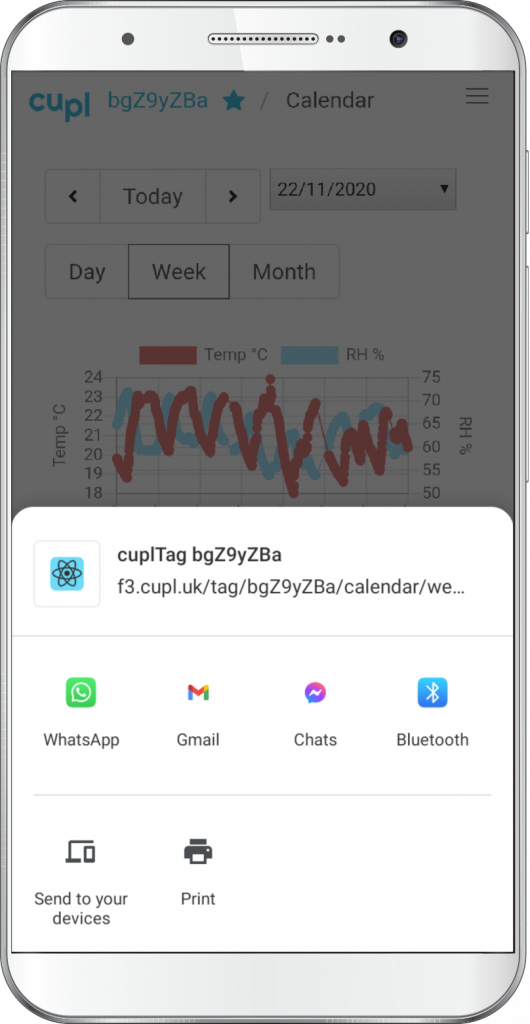 Pressing the share button invokes the Web Share API, if available. If not a link is copied to the clipboard.
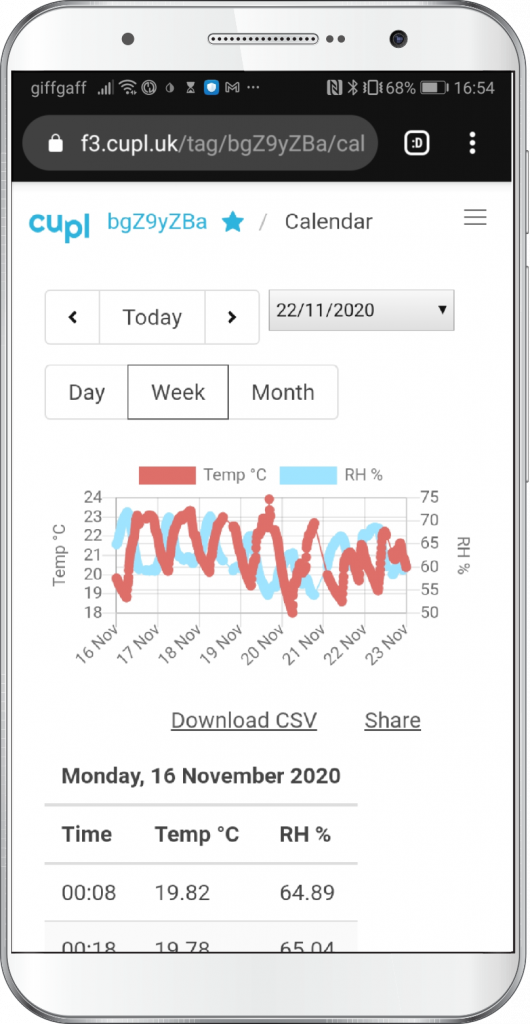 Plot of samples for one week.
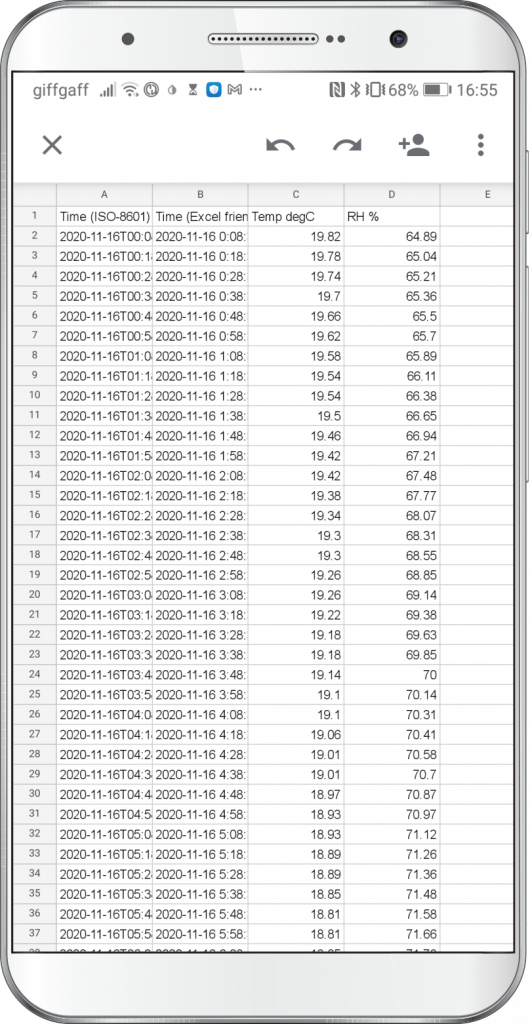 Pressing the download CSV button exports data.
Capture View
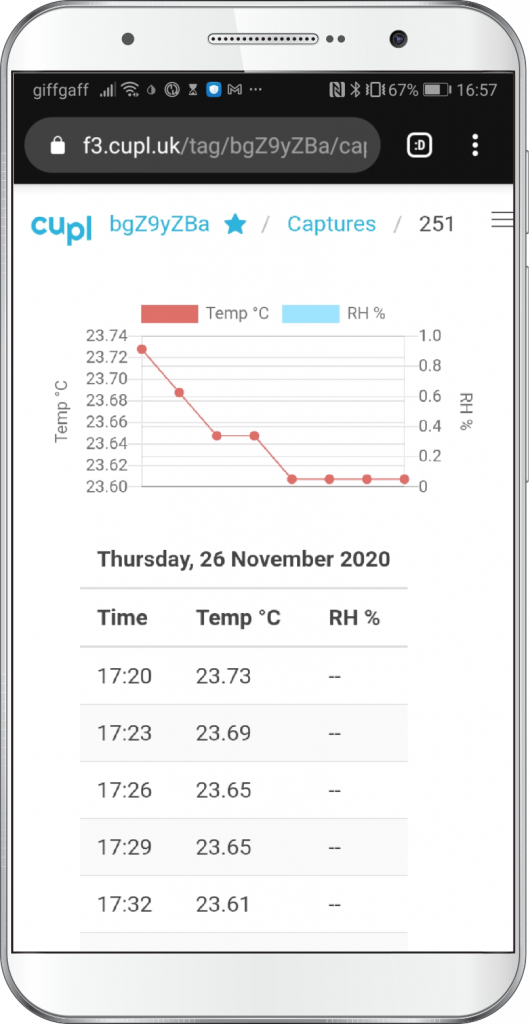 Tag data can be viewed capture-by-capture.
Battery Plot
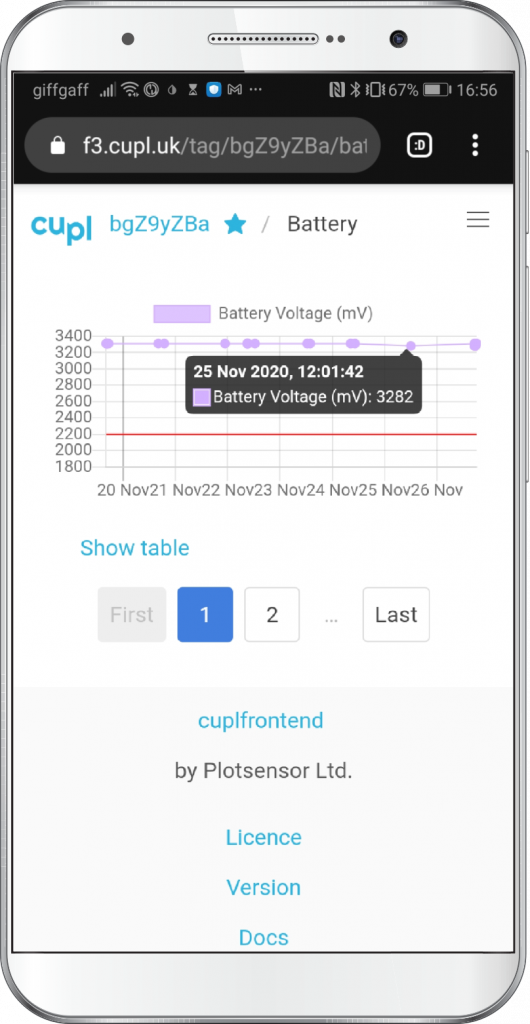 Tag battery voltage is plotted over time.